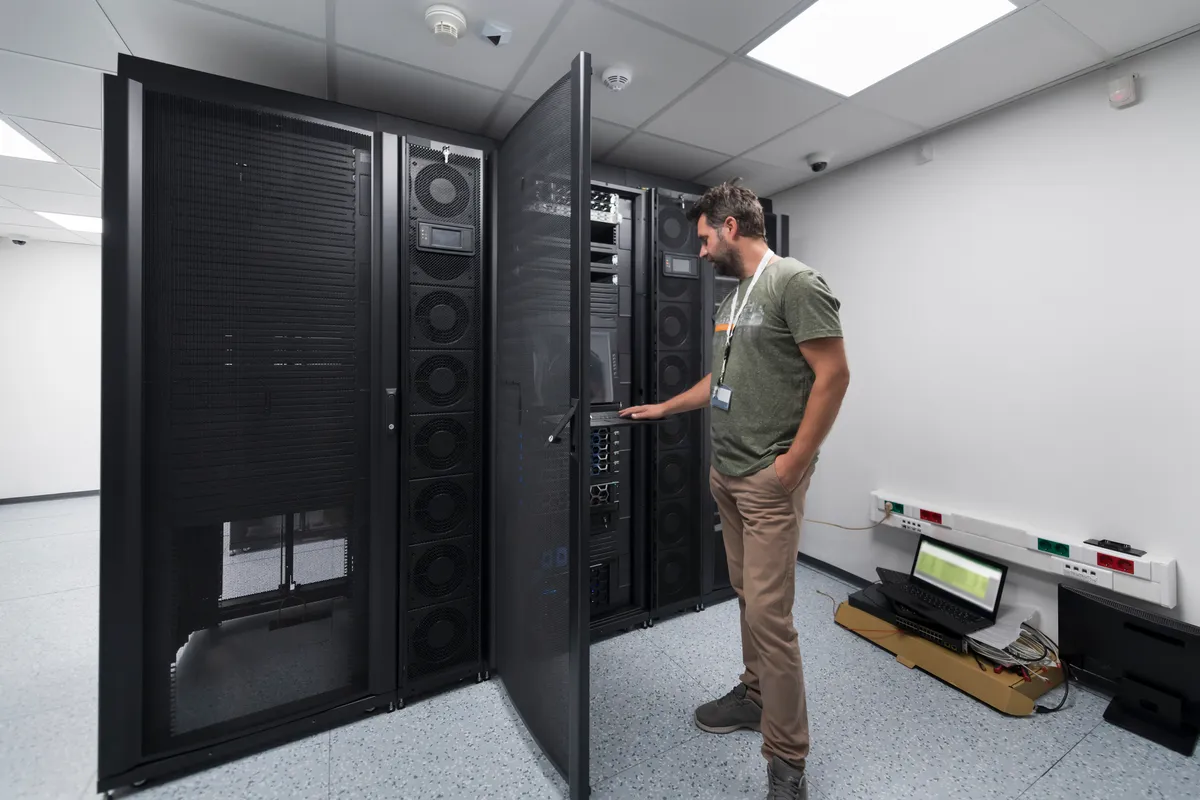
Filtration monitoring

Continuous differential pressure tracking, lifecycle forecasting, and energy optimization across your entire filter estate.

Differential pressure

DeltaP monitoring across every filter bank

Differential pressure is the single most important indicator of filter health. TERA 360 monitors DeltaP continuously across all your filter stages — from pre-filters to HEPA and ULPA — and turns raw pressure data into actionable maintenance intelligence.

Continuous measurement

Real-time DeltaP readings from analog pressure transducers or digital sensors. Sub-minute sampling rate ensures that no pressure spike goes undetected. Automatic sensor health checks flag drift or failure immediately.

  • Analog 4-20 mA and 0-10 V inputs
  • Digital Modbus sensors via ModLinkChainer
  • Sub-minute sampling rate
  • Sensor drift and failure detection

Multi-stage tracking

Monitor each filtration stage independently: G4 pre-filters, F7/F9 bag filters, H13/H14 HEPA filters, U15/U16 ULPA filters. Visualize the pressure drop profile across the entire air handling unit on a single dashboard.

  • Pre-filter, fine filter, HEPA/ULPA stages
  • Cumulative AHU pressure drop view
  • Individual filter bank identification
  • Cross-AHU comparison

Threshold alerting

Configure warning and critical DeltaP thresholds per filter type and stage. Alerts fire when pressure drop approaches the manufacturer's maximum rated value — giving maintenance teams time to schedule replacement before air quality degrades.

  • Per-filter-type threshold configuration
  • Warning and critical alert levels
  • Rate-of-change alerts for sudden clogging
  • Automatic maintenance ticket creation
TERA 360 filter lifecycle dashboard showing DeltaP trends and replacement forecast
Lifecycle management

From installation to replacement

Every filter in TERA 360 has a complete lifecycle record — from the day it was installed to the day it is replaced. This data drives smarter procurement, better scheduling, and lower total cost of ownership.

  • Installation tracking — Record filter type, manufacturer, batch number, installation date, and location. Barcode or QR code scanning for fast field entry.
  • DeltaP trending — Continuous pressure drop curve from clean filter (initial DeltaP) to end-of-life. Compare actual aging against the manufacturer's expected curve to detect abnormal loading.
  • Replacement forecasting — Machine-learning models predict remaining useful life based on the DeltaP trend, airflow conditions, and seasonal patterns. Forecast accuracy improves as the system learns your specific environment.
  • Replacement confirmation — When a filter is replaced, the technician logs the swap in TERA 360 (mobile or tablet). The system verifies the DeltaP reset and starts tracking the new filter automatically.
HVAC integration

Connected to your air handling units

Filtration does not exist in isolation — it is part of the HVAC system. TERA 360 correlates filter data with fan speed, airflow rate, supply temperature, and room pressure to give operators a complete picture.

BMS data correlation

Ingest fan speed, VFD frequency, damper position, and supply/return temperatures from your BMS via Modbus. Overlay HVAC operating parameters on filter DeltaP charts to understand cause and effect.

  • BMS integration via Modbus RTU/TCP
  • Fan speed and VFD frequency correlation
  • Damper position tracking
  • Supply/return temperature overlay

Airflow impact analysis

As filters load, fan energy increases to maintain airflow. TERA 360 quantifies this relationship — showing exactly how much additional energy each filter bank is consuming as it ages. This data justifies optimal replacement timing.

  • DeltaP vs. airflow rate curves
  • Fan energy consumption attribution
  • Filter-induced pressure loss trending
  • Optimal replacement point calculation
Energy optimization

Smart filter management saves energy

Replacing filters too early wastes money. Replacing them too late wastes energy and risks air quality. TERA 360 finds the optimal balance — and proves it with data.

Cost-benefit optimization

The platform continuously calculates the economic crossover point: when the energy cost of pushing air through a loaded filter exceeds the cost of replacing it. This is not a fixed threshold — it adapts to electricity prices, filter costs, and seasonal airflow demands.

  • Dynamic replacement cost modeling
  • Electricity price integration (spot or contract)
  • Filter procurement cost tracking
  • Labor cost estimation for replacement

Energy reporting

Quantify the energy impact of your filtration strategy. Monthly reports show kWh consumed per filter bank, cost per cubic meter of clean air delivered, and energy savings from optimized replacement scheduling.

  • kWh per filter bank per month
  • Cost per m3 of clean air delivered
  • Energy savings vs. fixed-schedule replacement
  • Carbon footprint reduction tracking

Procurement planning

Replacement forecasts feed directly into procurement workflows. Know exactly which filters you will need, in which quantities, and when — eliminating emergency orders and reducing inventory carrying costs.

Maintenance scheduling

Group filter replacements across AHUs to minimize downtime. TERA 360 identifies clusters of filters approaching end-of-life and suggests consolidated maintenance windows that reduce HVAC shutdown time.

Sustainability metrics

Track filter waste volume, energy consumption trends, and carbon footprint of your filtration operations. Generate sustainability reports aligned with ISO 50001 energy management requirements.

15%
Average energy savings
30%
Fewer emergency replacements
24/7
DeltaP monitoring
3x
Faster root cause analysis

Optimize your filtration costs

See how TERA 360 predicts filter replacements and reduces energy waste — using your actual HVAC data.

Request a Demo