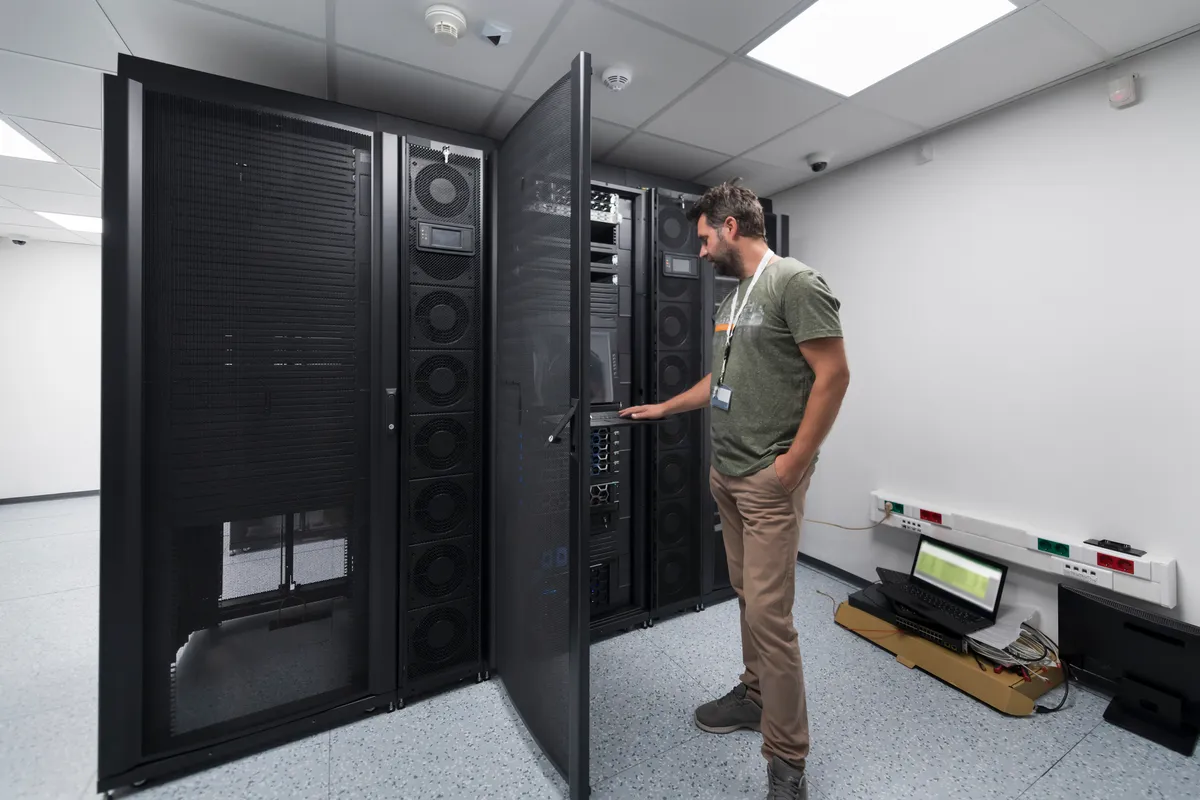
Occupancy-driven HVAC for multi-zone buildings

28% energy reduction by correlating real occupancy patterns with HVAC operation. Zone-by-zone IAQ monitoring with EN 16798 compliance tracking.

The context

HVAC driven by real occupancy, not schedules

Multi-zone commercial buildings present a unique challenge: every floor, every meeting room, every open-plan space has its own occupancy profile. Yet HVAC systems run on fixed time schedules that ignore this reality.

TERA 360 overlays real-time occupancy and indoor air quality data onto your existing BMS, creating a feedback loop that reduces energy while improving comfort. The result: buildings that breathe in rhythm with their occupants.

-28%

Measured energy reduction across deployed commercial buildings

50+

Zones monitored simultaneously per site

EN 16798

Continuous compliance with indoor environmental quality standards

18 months

Typical payback period for deployments

The challenge

Buildings run on schedules, not occupancy

Fixed schedules, variable occupancy

Most commercial buildings run HVAC on time-of-day schedules: full power from 7 AM to 7 PM, reduced overnight. But actual occupancy varies dramatically — conference rooms sit empty 60% of the time, floors run at 30% on Fridays, and after-hours usage is unpredictable. The mismatch between schedule and reality wastes 20-40% of HVAC energy.

No correlation between IAQ and energy

BMS systems control HVAC. Separate IAQ sensors (if any exist) log data to a different platform. There is no feedback loop: CO2 spikes in a meeting room do not trigger increased ventilation; an empty floor gets the same air changes as a packed one. Comfort and energy exist in silos.

Multi-site complexity

Property managers overseeing multiple buildings have no unified dashboard. Each building has its own BMS, its own data format, its own maintenance team. Benchmarking performance across the portfolio is manual, slow, and imprecise.

Regulatory pressure on IAQ

EN 16798 establishes indoor environmental quality categories. Increasingly, lease agreements, green building certifications (HQE, BREEAM, LEED) and corporate ESG mandates require documented IAQ performance. Building managers need proof, not promises.

How TERA 360 works

Zone intelligence for smarter buildings

TERA 360 overlays real-time occupancy and IAQ data onto your existing BMS, creating a feedback loop that reduces energy while improving comfort.

1

Sense every zone

CO2, PM2.5, temperature and humidity sensors deployed per zone. Occupancy detection via PIR, CO2-based estimation or integration with access control and booking systems. Energy meters at AHU and zone level.

2

Build the occupancy model

Machine learning models trained on historical patterns predict occupancy per zone, per hour, per day of week. Predictions feed into HVAC pre-conditioning schedules — the system anticipates demand rather than reacting to it.

3

Optimize and verify

TERA 360 sends setpoint adjustments to the BMS via Modbus. Actual IAQ is monitored continuously to verify that comfort targets (EN 16798 Category II) are maintained. If CO2 or temperature deviates, the system compensates immediately.

Sensors & systems

Measurement layer for commercial environments

CO2 & PM2.5

NDIR CO2 sensors for occupancy-correlated ventilation. Laser-scattering PM2.5 sensors for particulate matter tracking. Both provide EN 16798 compliance data.

T/H sensors

Zone-level temperature and humidity monitoring. Critical for thermal comfort assessment per EN 16798 and for identifying HVAC dead zones or overconditioned areas.

Occupancy detection

PIR sensors, CO2-based estimation algorithms, or integration with access control and room booking systems. Multi-source fusion provides robust occupancy data per zone.

Energy & BMS

Sub-meters at AHU and zone VAV level. Modbus integration with existing BMS for bidirectional data exchange. TERA 360 reads and writes — monitoring and optimization from a single platform.

TERA 360 commercial building monitoring dashboard with zone heatmaps and IAQ scores
Dashboards & alerts

Portfolio visibility from zone to campus

Unified view of all your buildings with energy performance, IAQ scores and comfort indices — from portfolio to zone.

  • Multi-site portfolio view — All buildings on a single dashboard. Ranked by efficiency, flagged by exceptions. Drill down from portfolio to building, floor to zone. Property managers see the big picture; facility teams get the detail.
  • Zone heatmaps — Floor plans overlaid with real-time CO2, temperature, PM2.5 and occupancy data. Color gradients reveal over-ventilated empty zones and under-ventilated crowded areas. Historical playback over days, weeks and seasons.
  • Energy analytics — Per-zone energy consumption normalized by occupancy hours and degree-days. Benchmark zones against each other. Monthly reports quantifying savings versus the previous fixed-schedule baseline.
  • Comfort & compliance reports — EN 16798 compliance percentage per zone, per month. Thermal comfort hours logged. IAQ excursion reports. Green building certification data packages generated automatically for HQE, BREEAM and LEED.
Benefits

Less energy, better comfort, proven compliance

-28%

Energy consumption measured across deployed commercial buildings. Achieved through occupancy-driven setbacks, predictive pre-conditioning, and elimination of over-ventilation in unoccupied zones.

+comfort

Improved tenant satisfaction. Real-time IAQ feedback ensures comfort targets are met consistently. Fewer hot/cold complaints, better air quality, and transparent reporting.

EN 16798 compliance

Continuous monitoring provides documented evidence of indoor environmental quality. Compliance data feeds directly into green building certification submissions and ESG reporting.

Data-driven maintenance

HVAC performance anomalies identified early through zone-level monitoring. Filter degradation, valve failures and sensor drift detected before they impact comfort or energy performance.

28%
Energy reduction
50+
Zones monitored
16798
EN compliance
18 months
Payback

Ready to optimize your building portfolio?

We'll assess your buildings, model the savings potential, and deploy zone-by-zone monitoring.

Discuss your project